Gene Set Summary Statistics
From genomewiki
Revision as of 15:55, 13 March 2014 by Matt Speir (talk | contribs) (→summary of intron size statistics)
gene sets measured
- hg17 - knownGenes version 2
- hg18 - knownGenes version 3
- hg19 - knownGenes version 7
- mm8 - knownGenes version 2
- mm9 - knownGenes version 3
- mm10 - knownGenes version 6
The min, max and mean measurements are per gene
summary of gene and exon counts
| db | gene count | total exon count | min exon count | max exon count | mean exon count |
|---|---|---|---|---|---|
| hg17 | 39368 | 405720 | 1 | 149 | 10 |
| hg18 | 56722 | 519308 | 1 | 2899 | 9 |
| hg19 | 82960 | 742493 | 1 | 5065 | 9 |
| mm8 | 31863 | 314628 | 1 | 313 | 10 |
| mm9 | 49220 | 417114 | 1 | 610 | 8 |
| mm10 | 59121 | 486425 | 1 | 813 | 8 |
summary of exon size statistics
| db | sum exon sizes | min exon size | max exon size | mean exon size |
|---|---|---|---|---|
| hg17 | 106839720 | 1 | 18172 | 263 |
| hg18 | 146371091 | 1 | 36861 | 282 |
| hg19 | 221924089 | 1 | 205012 | 299 |
| mm8 | 83159087 | 4 | 17497 | 264 |
| mm9 | 117671086 | 1 | 29698 | 282 |
| mm10 | 143087341 | 1 | 83437 | 294 |
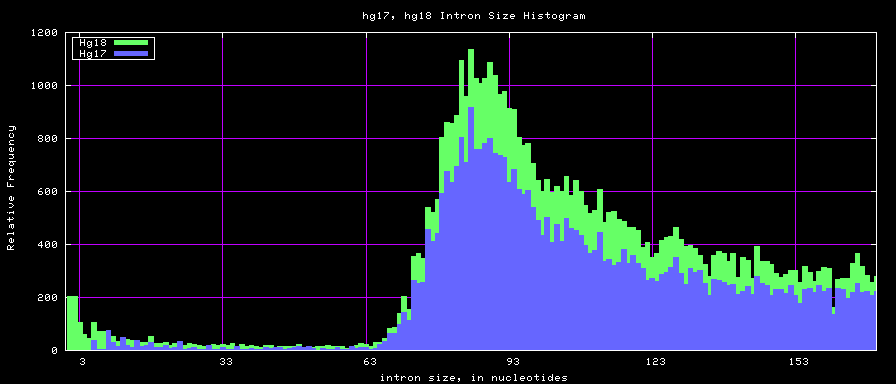
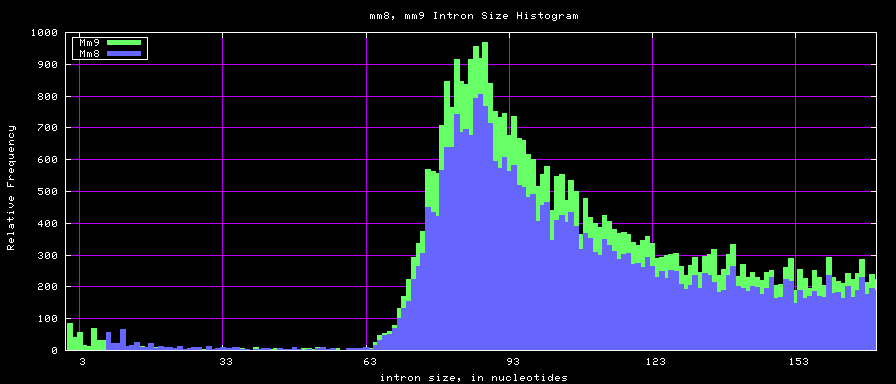
summary of intron size statistics
| db | sum intron sizes | min intron size | max intron size | mean intron size |
|---|---|---|---|---|
| hg17 | 2223224397 | 6 | 1096450 | 6069 |
| hg18 | 2784923600 | 1 | 1047320 | 6023 |
| hg19 | 4127555916 | 1 | 1160410 | 6260 |
| mm8 | 1476081990 | 9 | 1347550 | 5220 |
| mm9 | 2055504784 | 1 | 1253430 | 5589 |
| mm10 | 2420504661 | 1 | 3003780 | 5665 |
Top five exon count genes
| db | gene name (exon count) | ||||
|---|---|---|---|---|---|
| hg17 | NM_004543 (149) | AF535142 (146) | AF535142 (146) | NM_033071 (146) | AF495910 (146) |
| hg18 | uc001yrq.1 (2899) | uc002zvw.1 (322) | uc002umr.1 (313) | uc002stk.1 (217) | uc002umt.1 (194) |
| hg19 | uc031qqx.1 (5065) | uc031rxg.1 (462) | uc031rqc.1 (363) | uc031rqd.1 (313) | uc021vsy.2 (312) |
| mm8 | NM_011652 (313) | NM_028004 (192) | NM_007738 (118) | NM_134448 (99) | DQ067088 (99) |
| mm9 | uc007pgj.1 (610) | uc008kfn.1 (313) | uc008kfo.1 (192) | uc008jqv.1 (157) | uc009rrh.1 (118) |
Top five largest CDS extent genes
| db | gene name (CDS extent size: thickEnd-thickStart) | ||||
|---|---|---|---|---|---|
| hg17 | NM_014141 (2298740) | NM_000109 (2217347) | CR749820 (2138880) | NM_004006 (2089394) | X14298 (2089394) |
| hg18 | uc003weu.1 (2298740) | uc004ddb.1 (2217347) | uc001pak.1 (2138880) | uc004dda.1 (2089394) | uc003wqd.1 (2055833) |
| hg19 | uc021ott.2 (2307732) | uc003weu.2 (2298740) | uc004ddb.1 (2217347) | uc001pak.2 (2138880) | uc004dda.1 (2089394) |
| mm8 | NM_007868 (2253366) | NM_001004357 (2238304) | NM_053011 (2055883) | AK134694 (1988713) | NM_053171 (1639258) |
| mm9 | uc009tri.1 (2253366) | uc009bst.1 (2238325) | uc007zfr.1 (2189582) | uc008jon.1 (2055883) | uc008mpv.1 (1988713) |
Top five smallest transcript genes
| db | gene name (transcript size: txEnd-txStart) | ||||
|---|---|---|---|---|---|
| hg17 | AF241539 (168) | AF277175 (176) | AY459291 (240) | AY605064 (243) | AF503918 (258) |
| hg18 | uc004buj.1 (20) | uc001dcm.1 (22) | uc001seo.1 (22) | uc001sqn.1 (22) | uc002wpa.1 (22) |
| hg19 | uc031pxj.1 (19) | uc021qzo.1 (19) | uc021pfi.1 (20) | uc021oot.1 (20) | uc021qbd.1 (20) |
| mm8 | AJ319753 (217) | BC107019 (231) | BC016221 (286) | NM_130876 (303) | NM_130873 (304) |
| mm9 | uc007bma.1 (22) | uc007gmr.1 (22) | uc007khz.1 (22) | uc007pay.1 (22) | uc007qpn.1 (22) |
Custom Track of Small Exons and Introns
Custom track: Hg18 small exons and introns on the UCSC Genes track
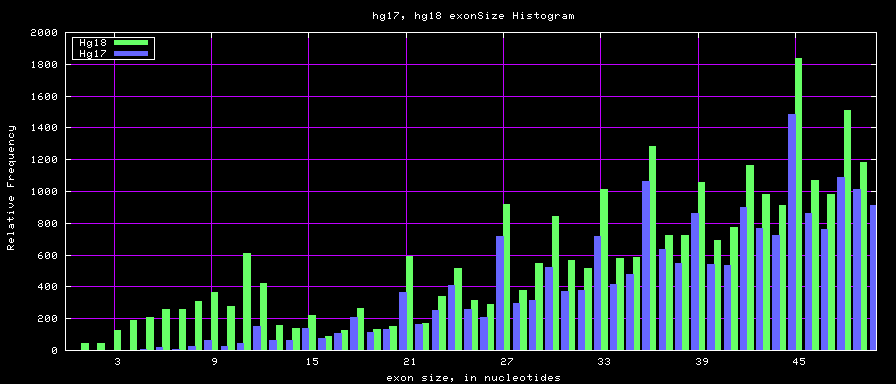
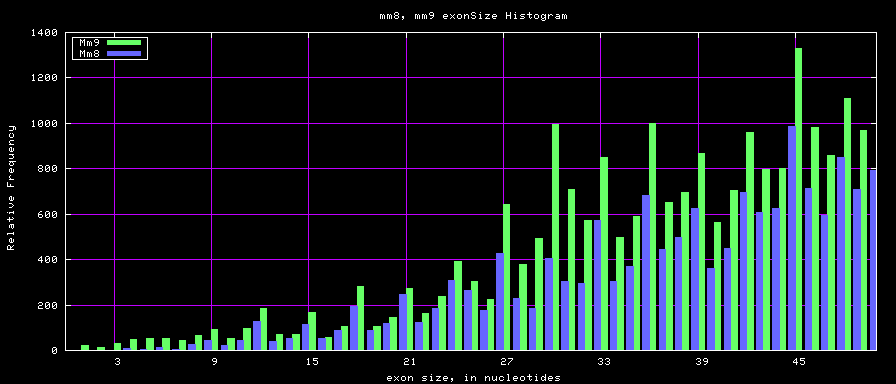
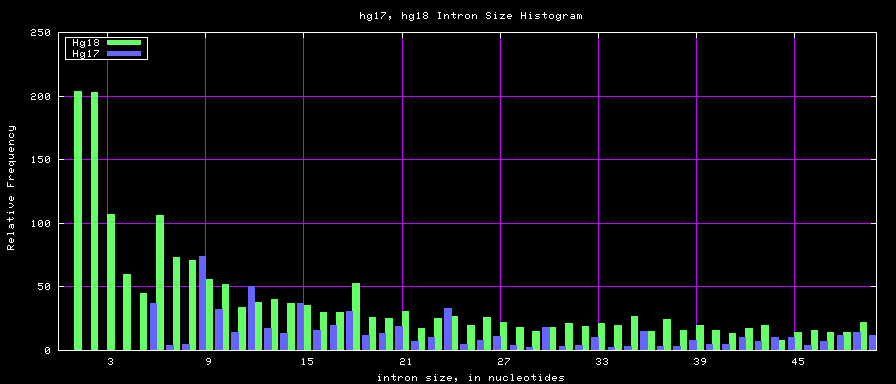
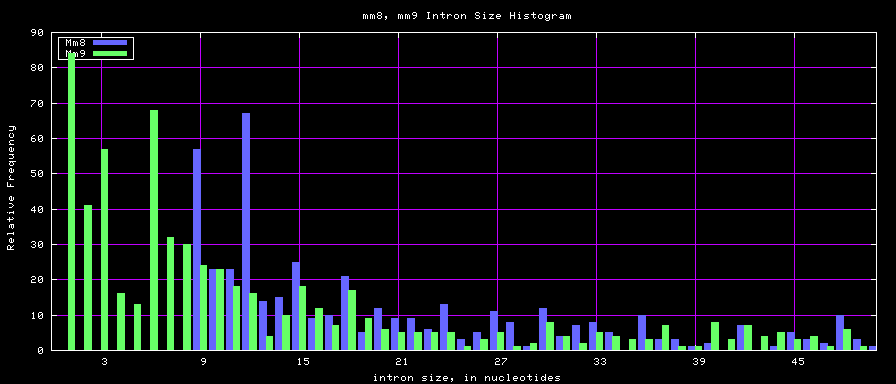
These are exons of size less than 22 bases, and introns of size less than 12 bases. The score column contains the size and thus you can filter smaller subsets via the score column in the table browser.
These small exons and introns are used to maintain frame coding boundaries as found in mRNAs compared to the reference genome coordinates.
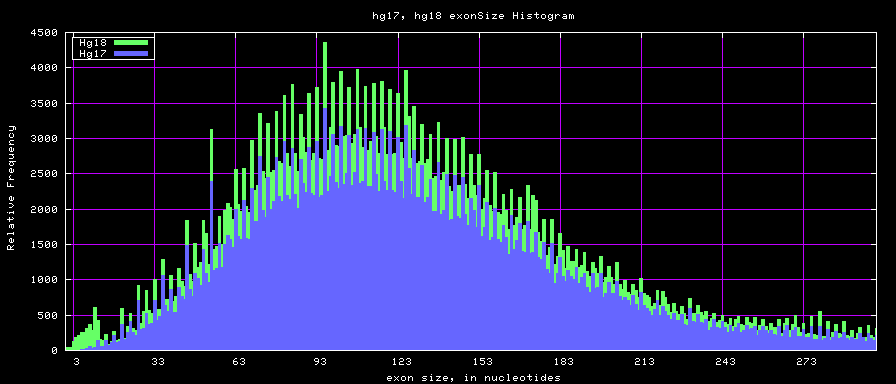
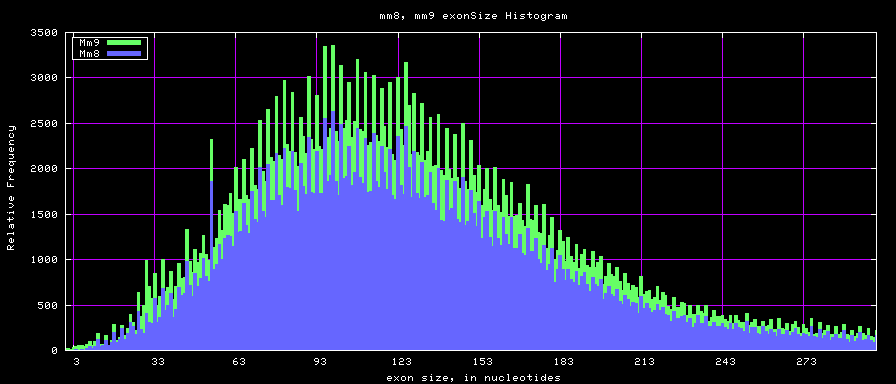
Histogram graphs
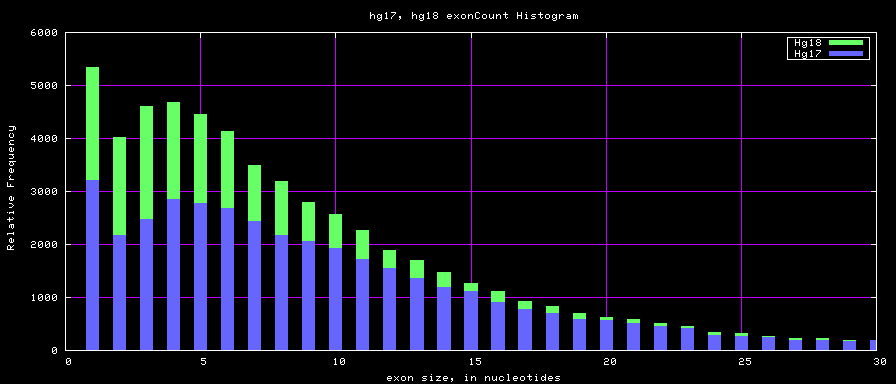 The caption on the graph above is incorrect. The X axis is Exon Count per Gene
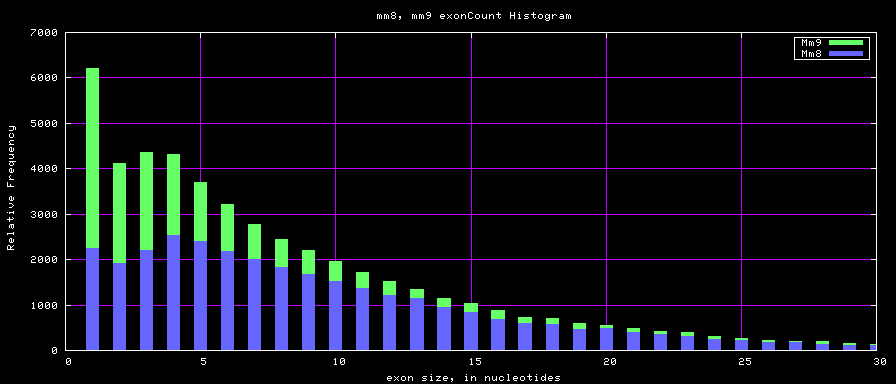 The caption on the graph above is incorrect. The X axis is Exon Count per Gene
Methods
- From the table browser, request three different bed files for the knownGenes track:
- whole gene
- exons only
- introns only
- From those bed files, stats can be extracted
- gene count from: 'wc -l wholeGene.bed'
- exon count stats from:
 STATS=`ave -col=10 wholeGene.bed -tableOut | grep -v "^#"`
 MIN=`echo $STATS | cut -d' ' -f1`
 MAX=`echo $STATS | cut -d' ' -f5`
 MEAN=`echo $STATS | cut -d' ' -f6 | awk '{printf "%d", $1+0.5}'`
 COUNT=`echo $STATS | cut -d' ' -f8 | awk '{printf "%d", $1}'`
- for exon or intron size stats:
 STATS=`awk '{print $3-$2}' {introns,exons}.bed \
      | ave -col=1 stdin -tableOut | grep -v "^#"`
 MIN=`echo $STATS | cut -d' ' -f1`
 MAX=`echo $STATS | cut -d' ' -f5 | awk '{printf "%d", $1}'`
 MEAN=`echo $STATS | cut -d' ' -f6 | awk '{printf "%d", $1+0.5}'`
 SUM_SIZE=`awk '{sum += $3-$2} END{printf "%d", sum}' {introns,exons}.bed`
- top five exon count genes
sort -k10nr wholeGene.bed | head -5
- top five CDS size genes
awk '{cdsSize=$8-$7
if (cdsSize > 0) {printf "%s\t%s\t%s\t%s\t%d\n", $1,$2,$3,$4,cdsSize}
}' wholeGene.bed | sort -k5nr | head -5
- top five smallest transcript genes
awk '{size=$3-$2
if (size > 0) {printf "%s\t%s\t%s\t%s\t%d\n", $1,$2,$3,$4,size}
}' wholeGene.bed | sort -k5n | head -5
